
The virtual assistant industry stands at a defining moment. Once viewed as a niche support service, it has evolved into a critical pillar of the global workforce and business transformation. Beyond 2025, the world is expected to witness a record surge in remote-first operations, automation-assisted workflows, and hybrid teams where human virtual assistants (VAs) play the central role in bridging efficiency and empathy.
This report — previously available as a gated download and now published in full — examines how the VA ecosystem, from independent professionals to managed service providers, is scaling across continents, industries, and functions. Drawing on recent market studies, hiring data, platform analytics, and Wishup's anonymized internal data from US business owners, it covers market dynamics, regional growth patterns, technology integration, and the outlook through 2035. Journalists, analysts, and researchers are welcome to cite any of the statistics below with attribution.
1. Market Size: A Decade of Durable Expansion
The global virtual assistant services market has entered a decisive growth phase. It's no longer an experimental outsourcing model, but a core driver of how modern businesses operate.
According to Fact.MR's virtual assistant services market analysis:
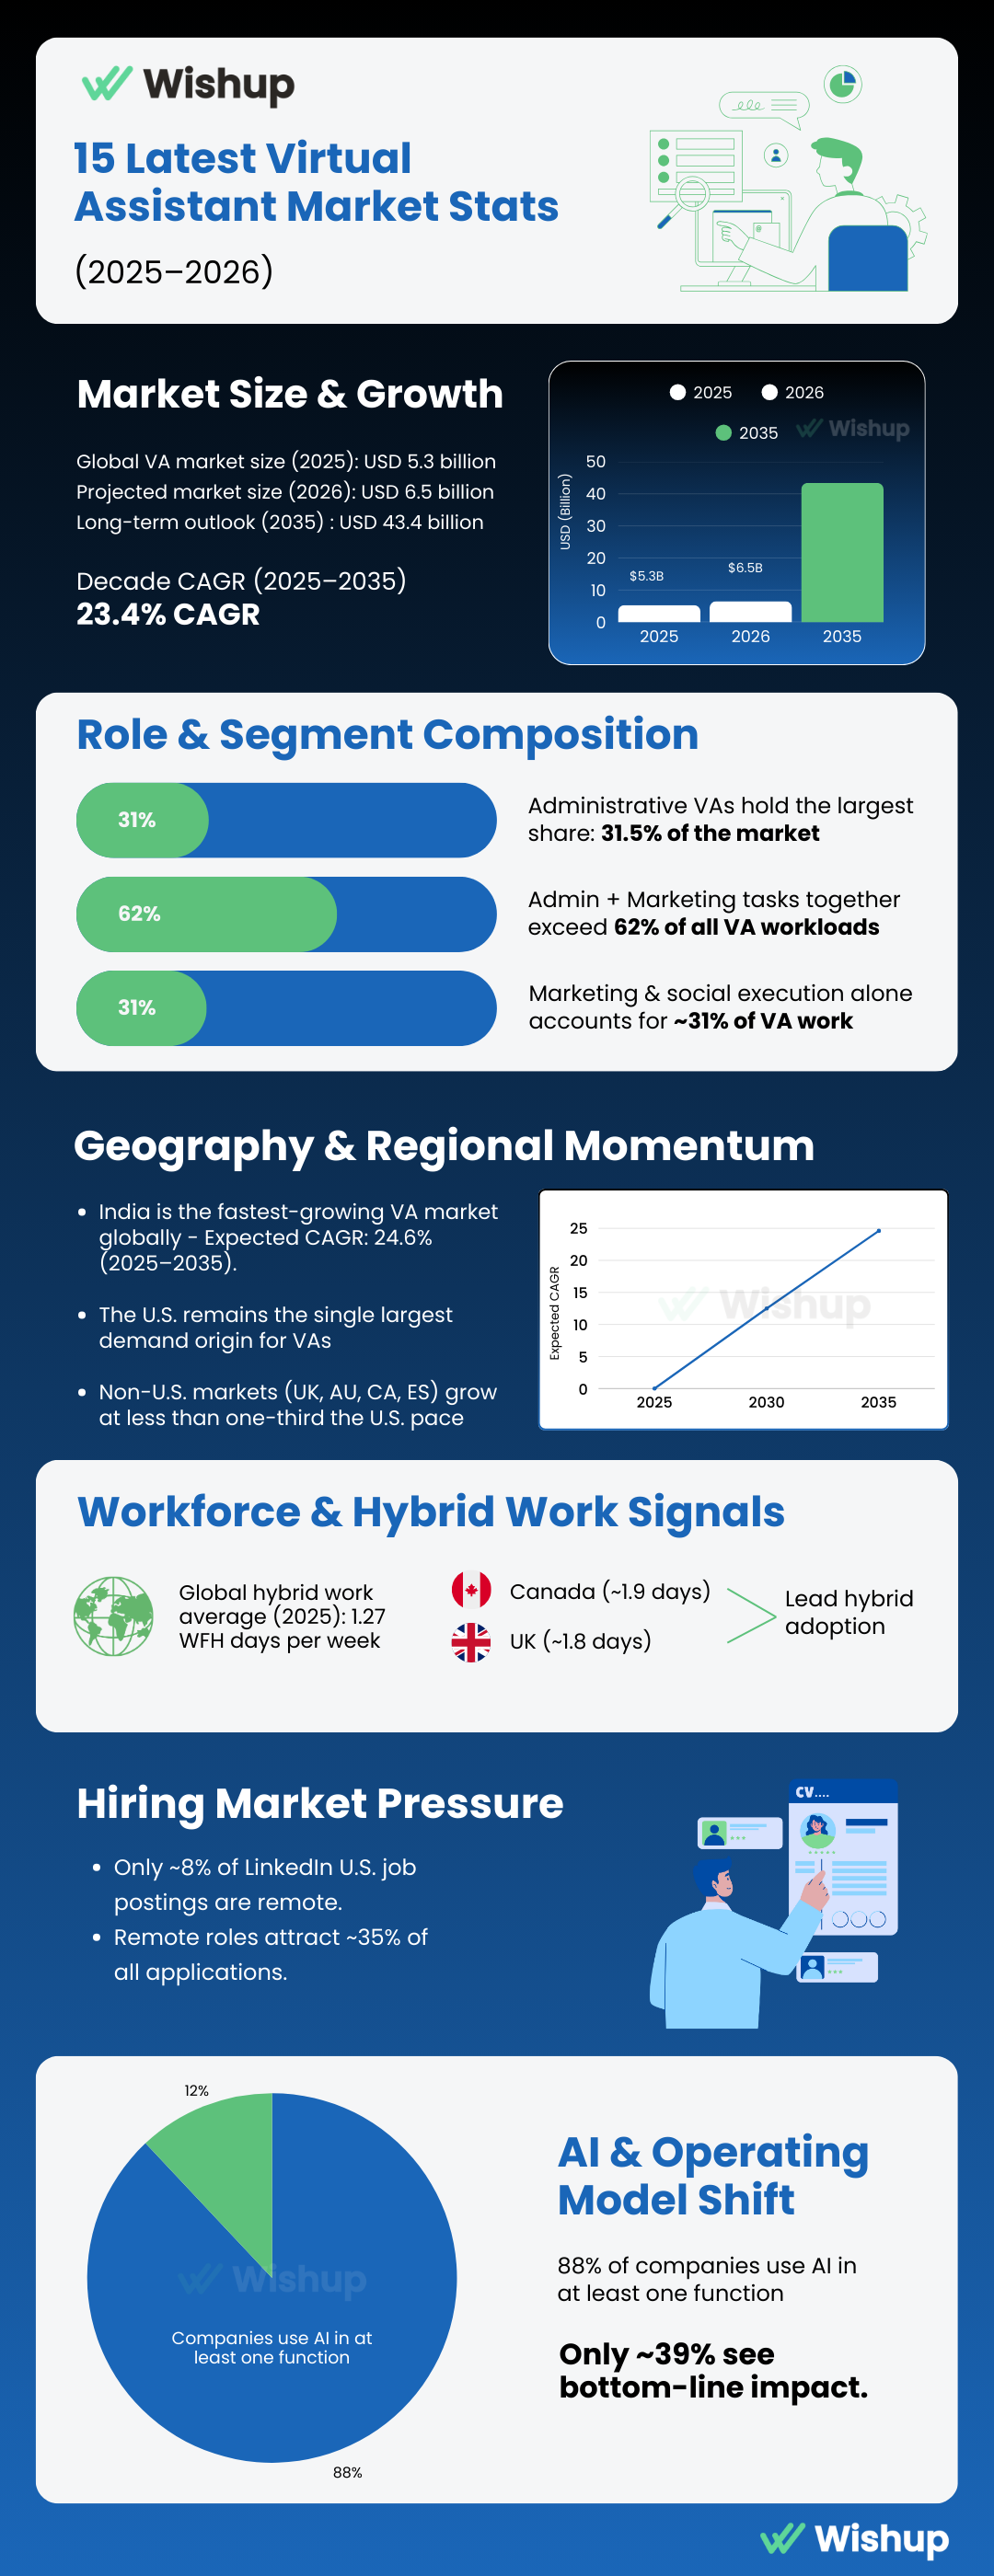
- The market size for VA services in 2025 is estimated at USD 5.3 billion, projected to reach USD 6.5 billion by 2026, and an impressive USD 43.4 billion by 2035.
- That reflects a decade-long CAGR of 23.4% — roughly 2.34% average compounded growth per year, one of the fastest among service-based remote work industries.
- Administrative virtual assistants currently hold the largest segment share at 31.5%.
- India is the fastest-growing market, expected to expand at a 24.6% CAGR (2025–2035), fueled by an abundant skilled workforce, cost efficiency, and a rapidly digitizing SME ecosystem.
Future Market Insights' market forecast charts a parallel long-range trajectory:
- Between 2025 and 2030, the market is forecast to grow from USD 19.5 billion to USD 32.9 billion, adding USD 13.3 billion in just five years — roughly 37 percent of total decade growth, driven primarily by enterprise reliance on administrative, customer service, and finance/accounting support. That's 68.7% growth from 2025 to 2030.
- From 2030 to 2035, growth is projected to add another USD 22.5 billion, taking the market to USD 55.4 billion — a jump equal to 62.8 percent of total decade expansion, or 68.4% growth in the 2030–2035 window.
- Dedicated monthly VAs are projected to command 53.5% of the entire market in 2025, and already support more than 53 percent of long-term client relationships.
- SMBs make up 44.4% of the client base — the businesses that rely most heavily on predictable, repeatable support.
The acceleration in the back half of the decade will coincide with the maturation of AI-orchestrated workflows and the rise of agency-managed hybrid teams that blend automation with human expertise. As businesses automate repetitive inputs, the value shifts toward coordination, decision support, and oversight — domains where human VAs excel.
2. Business Task Distribution: What VAs Actually Did in 2025
(Based on anonymized internal data from US business owners surveyed by Wishup.)
| Task Category | Share % |
|---|---|
| Executive/Admin | 31.7% |
| Marketing & Social | 31.1% |
| Project & Ops | 13.4% |
| Research & Data | 9.5% |
| CRM & Sales Ops | 6.3% |
| Finance & Bookkeeping | 3.6% |
| Customer Support | 3.0% |
| AI & Automation | 1.4% |
Key readings from the 2025 work allocation:
- Executive & administrative work is still the core (31.7%) — inbox management, scheduling, documentation, routine coordination, and day-to-day operational upkeep. No automation has replaced dependable human judgment in time-sensitive, high-context administrative work.
- Marketing & social media nearly ties for first place (31.1%) — content posting, formatting and repurposing, social engagement, brand consistency, and coordinating marketing workflows. Founders outsource execution-heavy marketing while keeping strategy in-house.
- Admin + marketing together dominate over 62% of all VA workloads — the two things AI cannot fully handle: coordination and context, and consistent, human-led execution.
- Project & operations support is a stable middle layer (13.4%) — SOP upkeep, deadline management, task allocation — the glue for distributed teams.
- Research & data work is present but lean (9.5%) — market scans, competitor insights, and structured research summaries, with VAs used for interpretation and validation rather than brute-force information gathering.
- CRM & sales ops holds a focused share (6.3%) — CRM updates, lead tagging, follow-up workflows, and sales pipeline hygiene.
- Finance & bookkeeping remains a steady niche (3.6%) — expense tracking, reconciliations, invoice management, vendor payouts. Specialized accounting still requires certified professionals; VAs support the administrative layer of finance.
- Customer support takes a practical operational role (3%) — quicker response cycles, reduced founder inbox load, consistent client communication, and helpdesk management.
- AI & automation tasks begin their slow rise (1.4%) — ChatGPT-assisted tasks, Zapier automations, Notion AI workflows, document generation, and simple data automations. Small, but it signals a capability shift: VAs are becoming AI operators, not being automated out.
3. Tool & Platform Adoption Shifts (2024 → 2025)
(Based on anonymized internal data from US business owners surveyed by Wishup.)
Comparing internal task-level tool usage from 2024 to 2025 reveals a dramatic rebalancing: marketing-heavy platforms are contracting, operational and finance tools are expanding, and AI-enabled systems are steadily entering mainstream workflows.
Social media tools shrink — founders move to professional platforms:
- Instagram: 14% → 9.2%
- Facebook: 11.8% → 6.7%
- LinkedIn jumped dramatically: 4.4% → 9.2%
Business owners are shifting from content quantity to content quality. B2B audience-building is replacing mass social posting; LinkedIn has become the dominant growth channel for founders, and VAs are now executing more professional brand management and less consumer-style social media work.
Design and commerce work increase significantly:
- Canva: 2.2% → 5.1% (nearly doubles) — more founders are delegating brand asset creation, and visual content responsibilities are shifting from founders to their VAs.
- Shopify: 2.9% → 4.9% — growing ecommerce involvement and an uptick in VA tasks related to product pages, listings, micro-graphics, and content formatting.
Finance tool adoption shows strong growth: 5.8% → 8.8%.
- QuickBooks' jump is the single largest increase in the "operations" category: 5.1% → 7.9%. Drivers include the rise of fractional CFOs and outsourced finance stacks, the push for real-time cash flow clarity, increased complexity of online business revenue streams, and a shift toward structured, repeatable financial processes.
Tool stacks are consolidating. Declines in Zoho, Asana, Airtable, and Zapier show that founders want simpler, unified systems — not fragmented ecosystems. Teams prefer plug-ins or automations that integrate into existing collaborative platforms (Docs, Sheets, Notion) rather than adding many niche AI widgets.
The VA skill profile is becoming more technical. QuickBooks, Shopify, Sheets, HubSpot, and LinkedIn all expanded — tools that directly affect revenue, operations, and client delivery. The version of the VA founders will want in 2026 is more skilled, more platform-aware, and more context-driven.
A related workforce data point: 75 percent of managers feel administrative professionals' responsibilities have increased in the past 5 years.
4. Engagement Models: How Founders Work With VAs in 2025
(Internal sample from US business owners working with Wishup VAs.)
- Full-time VAs: 54.0%
- Half-day VAs (4–7 hours): 40.5%
- Part-time VAs (<4 hours): 5.5%
That means 94.5% of founders choose dedicated models — full-time or half-day. This aligns almost to the decimal with Future Market Insights' global reading that dedicated monthly VAs will command 53.5% of the market in 2025, with SMBs making up 44.4% of the client base.
Why dedicated engagement dominates:
- Workflows are process-based, not task-based. Founders offload entire processes — inbox management, lead qualification, social calendars, e-commerce operations, finance bookkeeping, CRM maintenance, internal coordination, and AI-assisted research and drafting. Continuity requires dedicated bandwidth.
- AI tools increased output — and the workload around it. Humans orchestrate AI, VAs refine AI drafts and manage multi-platform execution. AI has increased volume, not replaced roles — which is why sub-4-hour delegation is losing relevance.
- Fractional hiring is rising, but fractional hours are not. Founders prefer fractional roles (one VA who owns specific functions) over fractional hours (random hourly support with limited context).
- Full-time (54.0%) — the new "remote operator" model. These VAs function as embedded team members: operations anchors, scheduling gatekeepers, marketing executors, client success support, finance maintainers, and AI execution partners.
- Half-day (40.5%) — the sweet spot for bootstrapped SMBs: early-stage founders, solo business owners, consultants, ecommerce operators, and small marketing teams.
- Part-time (<4 hours) — only 5.5%, and shrinking, now used only for highly specialized or low-frequency tasks.
As venture capitalist Mark Suster put it: "Your single most valuable asset in the early days is your senior team... and you'll be bogged down in expense claims, booking hotel rooms, scheduling meetings, dealing with a leaky toilet, processing payroll, ordering computers, etc."
Another supporting data point: administrative professionals free up an average of 101 minutes a day for their managers.
5. Industry Mix: Which Sectors Rely on VAs the Most (2025)
(Internal sample from US business owners using Wishup VAs.)
Top 6 industries contribute 79.4% of total demand:
| Industry | Share % |
|---|---|
| Health Care | 25.4% |
| Marketing | 14.8% |
| Financial Services / Fintech | 13.9% |
| IT Services / IT Consulting | 11.5% |
| Real Estate | 8.7% |
| Media & Entertainment | 5.1% |
| Others (40+ niche sectors) | 20.6% |
These industries alone represent nearly 4 out of every 5 VA engagements. Healthcare, marketing, and fintech together account for 54% of VA demand — where business leaders are investing most heavily in delegation.
Healthcare (25.4%) — the largest and fastest-formalizing segment. Administrative burden is extremely high (intake, scheduling, insurance, follow-ups); clinicians increasingly run hybrid or remote care models; medical documentation needs are rising faster than staffing availability; and HIPAA-friendly process delegation is now standardized in many practices. The category spans independent clinicians, private practices, telehealth startups, healthtech workflows, wellness operators, and rehabilitation centers. A relevant macro signal: employment of medical assistants is projected to grow 12% from 2024 to 2034 — much faster than average — with about 112,300 medical assistant openings projected each year over the decade.
Marketing (14.8%) — from content assembly to full campaign support. VAs handle social posting and scheduling, Canva creatives, market research, content operations, email sequences, influencer outreach, community management, and reporting dashboards. Marketing grew slightly despite the explosion of AI content tools — because marketing teams need humans who can operate AI tools, not be replaced by them.
Financial Services / Fintech (13.9%) — high accuracy, high trust, high retention. VAs fit naturally into bookkeeping workflows, reconciliation, report preparation, CRM maintenance, lead qualification, investor relations admin, and compliance-related documentation. Once a VA plugs into a finance workflow, the relationship typically becomes permanent.
IT Services & IT Consulting (11.5%) — the hidden power-user segment. Documentation, client coordination, sprint reporting, ticket triage, meeting management, proposal drafting, research, platform administration, and LinkedIn brand ops — freeing senior talent from administrative drag.
Real Estate (8.7%) — a consistent, workflow-rich sector. Listing management, CRM upkeep, lead qualification, appointment setting, document prep, MLS tasks, property research, and client communication.
Media & Entertainment (5.1%) — high creative throughput, low administrative appetite. Production houses, content creators, podcasters, digital media agencies, and public personalities offload research, outreach, scheduling, workflow management, and asset organization.
The long tail: 40+ niche industries, each under 3% — including Health & Fitness, SaaS, Education/Edtech, E-Commerce, Coaching, Business Consulting, Legal, Biotechnology, Construction, Insurance, PR, Manufacturing, Design, Telecommunication, Logistics, Fashion, and NPOs — and even hyper-niche sectors like petcare, philanthropy, and jewelry retail. Once adoption crosses 40+ industries, the category is no longer niche — it's a widespread operational layer.
6. Global Outsourcing Footprint: Where VA Demand Originates
According to Teamstage's outsourcing statistics:
- More than 14.3 million tasks are outsourced by US businesses in a year.
- 37% of small businesses delegate at least part of their business processes to external teams or service providers — spanning IT and software development, call centers, executive assistance, bookkeeping, and administrative support.
Growth outside the US is strong but still sub-scale. Benchmarked against US relative growth:
- UK (GB): less than one-third of US relative growth
- Australia (AU): less than one-third of US
- Spain (ES): less than one-third of US
- Canada (CA): less than one-third of US
Wishup's internal sample mirrors this macro trend: US organizations represent the dominant client segment in both volume and growth rate. Three structural factors drive the disparity:
- Higher penetration of hybrid/remote workflows — the US embraced distributed teams faster and more permanently than EU and APAC markets.
- Earlier exposure to outsourcing ecosystems — India- and Philippines-based support functions have been embedded in US businesses for decades.
- Stronger startup and SMB density — a far larger base of early-stage founders, solopreneurs, online-first businesses, and consultants who feel operational pain earlier and outsource sooner.
As Sir Richard Branson, Founder of Virgin Group, has said: "I learned to focus on the things I was good at and delegate to others what I was not good at. That's how Virgin is run. Fantastic people throughout the Virgin Group run our businesses, allowing me to think creatively and strategically."
For US businesses, the takeaway: delegation is no longer a cost-cutting hack — it's an operational strategy, and non-US markets growing at less than one-third the US pace means American companies have a unique window to exploit outsourced operations before global demand tightens the talent market.
7. Hybrid Work: The Backbone of the Distributed Economy
Behind this market expansion lies a stable behavioral shift — hybrid work has normalized worldwide. Per Stanford SIEPR's "Working From Home in 2025: Five Key Facts", based on multi-country surveys covering 40 nations:
- As of 2025, the global average stands at 1.27 work-from-home days per week.
- Canada (~1.9 days) and the UK (~1.8 days) lead adoption, while Asia maintains lower averages due to denser in-office cultures.
- Employees with children are most likely to embrace split-week models, blending office and home days.
- Gender gaps in remote participation have largely closed — evidence of a mature hybrid system rather than a transient pandemic experiment.
Hiring signals: demand for remote roles outpaces supply
The labor market mirrors these structural shifts. On LinkedIn US (September 2025), only ~8 percent of paid job postings were tagged as remote — yet they attracted nearly 35 percent of all applications (Business Insider).
The co-founder & CEO of Deel put it bluntly: "A lot of the companies going back to the office are leaking talent to us, whether or not they want to admit it." And as Melanie Rosenwasser, Chief People Officer at Dropbox, summarized: "It's not about where we work, but how." (Source: Business Insider)
Remote and hybrid operations are not perks anymore — they are talent magnets. For the VA industry, this translates directly into steady inbound demand from businesses seeking distributed capacity without the friction of full-time hiring.
8. AI Adoption: Widespread but Uneven — Creating Space for Human Intelligence
If hybrid work is the operating model, AI is the toolset — and 2025 marks a turning point in how deeply organizations use it. According to McKinsey's State of AI report:
- Nearly 88% of companies have adopted AI in at least one business function.
- Yet only about one-third have managed to scale AI across the enterprise.
- 64% of companies say AI enables innovation, but only 39% report tangible bottom-line impact.
Goldman Sachs analyst Kash Rangan, speaking on the Goldman Sachs "Exchanges" podcast, captured the consumer–enterprise gap: "A lot of consumer applications, they're exemplifying the value of AI, whether it's ChatGPT or Claude... at the enterprise level and user level, there are some signs of life, but we're not where we expected." (Source: Business Insider)
Meanwhile, capital spending on AI infrastructure has surged, with vendor forecasts commonly referencing $3–$4 trillion in cumulative infrastructure investment through the end of the decade (Yahoo Finance / Nvidia). This build-out has created enormous pressure to demonstrate operational returns.
The conclusion is clear: AI alone isn't enough. The next phase of efficiency will emerge not from automation replacing people, but from people who know how to use AI effectively. This is precisely where virtual assistants are evolving — mastering AI-driven tools for research, reporting, communication, and workflow management, and defining a new category: the augmented workforce. The new work equation: Human + AI = The Competitive Core.
9. Brand Mindshare Through Digital Signals (2025)
In a category where customers begin their evaluation online, digital footprint becomes a practical indicator of market presence — measured here through three signals: search visibility (organic traffic), Domain Rating (DR), and referring domains. With reference to Ahrefs data, here's how the top managed VA companies stacked up in 2025:
| Company | Domain Rating | Referring Domains | Organic Traffic |
|---|---|---|---|
| Wishup.co | 72 | 3.3K | 33.4K |
| belaysolutions.com | 70 | 3.2K | 3.2K |
| (third provider — name illegible in source document) | 70 | 2.6K | 2.6K |
| getmagic.com | 68 | 1.9K | 1.9K |
| timeetc.com | 62 | 2.1K | 2.1K |
| wingassistant.com | 61 | 1.3K | 1.3K |
| myoutdesk.com | 54 | 1.2K | 1.2K |
| boldly.com | 53 | 2K | 2K |
| 20four7va.com | 45 | 1.3K | 1.3K |
| delegated.com | 37 | 352 | 352 |
Wishup's position at the top of the digital authority stack — highest DR, widest referring-domain coverage, and an order of magnitude more organic traffic than the next provider — signals a strong, established presence in a category where buyers begin their research online.
10. Market Pricing Overview (2025)
Virtual assistant pricing in 2025 reflects a wide global spread driven by three primary factors: geography, skill specialization, and engagement model. The ranges below summarize the external pricing landscape as reported in publicly available sources, including Wishup's November 2025 industry pricing analysis.
| Tier | Typical Range (USD) | Notes |
|---|---|---|
| Offshore Generalist | ~$8–$20/hr | Predominantly India, Philippines, Vietnam. Cost-efficient for administrative tasks, research, coordination, and standard business operations. |
| Onshore U.S. VA | ~$25–$45+/hr | Reflects higher labor costs, local business familiarity, and time-zone alignment. Often used for executive support or client-facing roles. |
| Specialist VA (Marketing, Bookkeeping, Technical) | ~$15–$75+/hr | Pricing varies by skill depth. Paid media assistants, CRM operators, bookkeepers, and technical support VAs sit at the higher end. |
| Full-Time / Monthly Models | Varies by provider | Monthly packages generally bundle hours, platform tools, and management. Pricing varies significantly depending on sourcing, vetting, and oversight. |
Key pricing dynamics:
- Location continues to be the single largest driver of cost. Offshore markets remain the most cost-efficient, with hourly rates one-third to one-fifth of onshore equivalents. The spread is primarily influenced by labor economics rather than skill availability — offshore regions now provide increasingly skilled talent, but the wage differential persists.
- Onshore models carry a premium due to context fluency — familiarity with local communication norms, time-zone alignment, industry-specific context, and client-facing responsibilities.
- Specialization has widened the pricing spectrum. A general administrative VA in India may cost $10–$15/hr, while a technical VA with CRM, automation, or finance skills can exceed $40/hr regardless of geography. Skill depth now matters as much as geography.
- The global midpoint remains stable despite inflation, because the supply of skilled offshore talent continues to grow, remote-first hiring has expanded the employer pool, and automation tools increase VA output without proportionally increasing costs.
- Monthly "full-time" and "half-time" models are increasingly common, though hard to compare across providers due to differences in vetting rigor, training, management involvement, replacement guarantees, and bundled software/tools.
11. Technology & AI Adoption: Sprawl, HITL, and the Road to 2028
The external picture: broad adoption, limited scale
Recent surveys show ~88% of companies report using AI in at least one business function, but only about one-third have scaled AI across the enterprise (McKinsey). While many organizations report AI enabling innovation, only roughly ~39% report that AI demonstrably affects their bottom line. The pattern: adoption → experimentation → selective value capture for a minority of firms.
Meanwhile, estimates commonly referenced put cumulative AI infrastructure investment at $3–$4 trillion through the end of the decade (Yahoo Finance), creating pressure to demonstrate operational returns. Analysts also note a consumer–enterprise gap: consumer-facing AI products demonstrate clear utility, while enterprise integration remains "fragmented and slower than expected" (Business Insider).
The key operational challenge: AI sprawl
"AI sprawl" describes the proliferation of point AI features and stand-alone AI tools — email assistants, helpdesk AI, PM summarizers, CRM auto-features — without coordinated governance or shared context (TechRadar). Why sprawl undermines ROI:
- Overlap: multiple tools solving similar problems increase cost without improving capability.
- Context loss: independent models do not share state or conversation history, so work must be re-contextualized between tools.
- Governance risk: fragmented models complicate data controls, auditing, and compliance.
These issues explain why infrastructure spending can outpace realized productivity gains.
The human-in-the-loop (HITL) model as the pragmatic path to value
Organizations that show measurable benefit from AI typically embed human oversight into AI-driven workflows. Why HITL works for service functions:
- AI handles volume tasks (drafting, summarization, search) while humans validate, apply judgment, and preserve context.
- Humans enforce SOPs and quality thresholds, reducing error rates and compliance exposure.
- Human operators connect AI outputs to downstream systems (CRM, billing, legal), realizing cross-system value.
This model aligns directly with VA operating realities — VAs manage workflows, perform quality control, and maintain client context.
Internal signals (Wishup): AI is a tool, not a replacement
Wishup's internal data for 2025 shows increased mentions and usage of AI tools (ChatGPT, Notion AI, Zapier automations) in client workflows — tied closely to SOPs, documentation, and project management rather than ad-hoc experimentation:
- AI mentions are rising across task descriptions, but inside Research, Content Drafting, SOP creation, and PM tasks rather than as an isolated category.
- Process and SOP growth accompany AI usage — teams document how AI should be used, when outputs require human revision, and how to route outcomes.
- Tool consolidation preference is emerging: teams prefer plug-ins or automations that integrate into existing collaborative platforms (Docs, Sheets, Notion) over many niche AI widgets.
Collectively, internal signals suggest VAs are becoming AI operators — using models to increase throughput while holding accountability for correctness and context.
Implications for VA operations in 2026
- VAs will be the frontline integrators of AI into small-to-medium business workflows. Founders access AI through their VAs; VAs fluent in prompt design, model verification, and output routing provide immediate operational value.
- SOPs and process governance become the highest-leverage investments. The primary lift is not buying better models but codifying when and how models are used, who validates output, and where outputs are stored and audited.
- Measuring value requires new KPIs beyond tool usage: percent of AI-assisted tasks with human validation (quality pass rate); time-to-action reduction for AI-augmented workflows; error/rollback rate for AI outputs requiring rework; and contribution of AI-assisted work to revenue or cost avoidance, tracked per process.
- Security, privacy, and compliance cannot be afterthoughts. Each integration must be evaluated for PII exposure, vendor data handling, and retention policies.
- Tool consolidation and interoperability win over tool proliferation. Platforms that let AI features share context, or that expose APIs for orchestration, reduce friction and sprawl.
Forecasted trajectory through 2028
- Short term (2025–2026): broad AI experimentation, rising HITL adoption in service functions, improved VA tooling literacy.
- Medium term (2026–2028): consolidation of tools, emergence of orchestration platforms, measurable ROI in high-frequency workflows, and increased regulatory attention on data usage.
- Long term (post-2028): deeper integration where 50–75% of routine task work is AI-augmented and governed via standardized orchestration layers; human roles focus on judgment, exception handling, and governance.
The Bottom Line
Across every credible tracker — market-sizing forecasts, workforce data, and hiring behavior — the message is consistent: the virtual assistant services market is not cyclical; it is structural. Hybrid work has stabilized at 1.27 WFH days per week globally, remote work remains aspirational for talent (8% of postings drawing 35% of applications), and AI adoption (88% adopted, only ~33% scaled, 39% seeing bottom-line impact) is creating new layers of opportunity rather than substitution.
A market growing from $5.3 billion in 2025 to $43.4 billion by 2035 at a 23.4% CAGR — with 94.5% of founders choosing dedicated engagement models and 40+ industries now adopting VAs — points to one conclusion: the decade ahead belongs to organizations that embrace the human + AI model, leveraging virtual assistants as the connective tissue of distributed work.
As Neelesh Rangwani, Co-Founder of Wishup, puts it: "As businesses continue to adopt hybrid models and AI integration, human virtual assistants will remain the backbone of scalable, intelligent operations." And in the words of Naetik Tandon, Head of Marketing at Wishup: "The virtual assistant space has entered its most exciting phase yet — where innovation, data, and human expertise converge."
How Was This Global Virtual Assistant Market Report 2026 Developed?
This report was built to answer one core question:
What is actually happening in the global virtual assistant market, and what is likely to happen next in 2026?
To do that, we combined multiple data sources, tracked trends over time, and focused on signals that show durability, not short-term spikes.
Here’s how the report came together.
Data Sources Used:
The findings in this report are based on a combination of primary and secondary data, including:
- Global surveys covering remote work adoption, outsourcing behavior, and operational roles
- 1259 Internal surveys covering Wishup’s longstanding clientele’s virtual assistant outsourcing behaviour
- Hiring platform data tracking remote job postings, role demand, and skill requirements
- Labor market data related to hybrid work, workforce participation, and talent availability
- External industry and market reports on outsourcing, AI adoption, and global services growth
Note: Each source was used to validate the others. No single dataset was taken at face value. Internal data points (task distribution, tool adoption shifts, engagement models, industry mix) are based on anonymized internal data from US business owners surveyed by Wishup. Journalists and researchers are free to cite these statistics with attribution and a link to this report.

Author - Neelesh Rangwani · Co-founder at Wishup
With 10+ years in the virtual assistant space, Neelesh has helped 1000+ US and global founders build efficient remote teams by matching them with top 0.1% virtual assistant talent. He writes about virtual assistants, hiring frameworks, remote productivity, and scaling ops.
More posts by Neelesh → · Connect on LinkedIn